David,
It would be really cool if you were able to compare the reality with some theory for me...
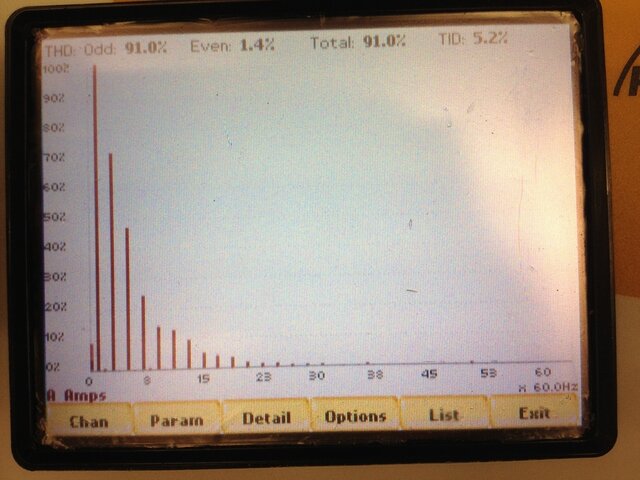
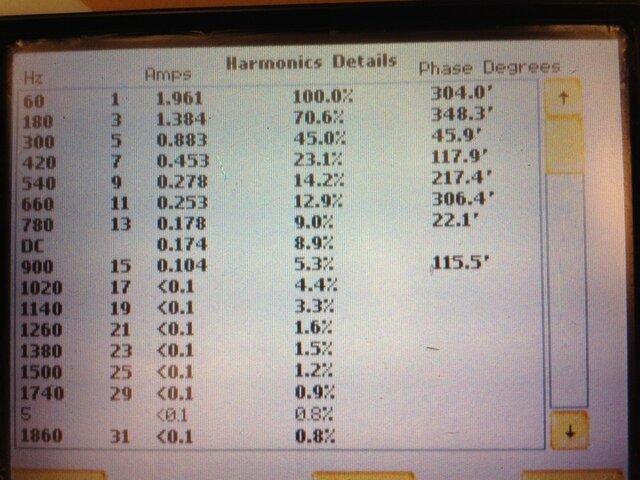
I've had excel do the maths of the harmonics on a 33% dimmed sine wave (ie. 33% duty cycle) and the graph is attached.
View attachment FFT of Dimmed waveform.pdf
Are you able to replicate it and see what the real harmonic plot looks like for a similarly dimmed state?
It would be really cool if you were able to compare the reality with some theory for me...
I've had excel do the maths of the harmonics on a 33% dimmed sine wave (ie. 33% duty cycle) and the graph is attached.
View attachment FFT of Dimmed waveform.pdf
Are you able to replicate it and see what the real harmonic plot looks like for a similarly dimmed state?